Background and objectives of the project
The Swiss Federal Office for Spatial Development has been maintaining the National Passenger Transport Model (NPVM) for twenty years. Since 2020, the model isx based on the current granularity of 8,000 zones and 1.7 million routes in the road and rail networks. The model is used, among other things, to forecast future traffic flows on national roads and in the public transport network, for nationwide noise calculations, and for various cantonal and academic applications. The Federal Office for Spatial Development commissioned Rapp AG to update the NPVM to the base year 2023, taking into account permanent changes in traffic behavior caused by the COVID pandemic.
Mandate and implementation
The challenge of modeling the «post-Covid» situation was mastered thanks to a detailed analysis of all empirical data available for 2023 on traffic behavior in Switzerland. Compared to 2017, the number of commutes will decrease by between 5% and 8% in 2023 – this decrease varies depending on the type of area due to the increase in working from home. In terms of mode of transport choice (known as the «modal split»), there will be a slight increase in cycling (including e-bikes) of 0.9 percentage points (pp) and in car use of 1.2 pp, compared with decreases of -0.8 pp for public transport and -1.2 pp for walking.
The following work objectives were also achieved:
- Simplifications and speed improvements in the model’s computing procedure;
- Integration of e-bikes – as an new mode choice alternative in addition to cars, public transport, walking, and cycling;
- Update of all input data to the year 2023, including the road network data, public transport lines and timetables, international and cross-border travel demand, and structural data (population, jobs, shopping and leisure attractions);
- Model output by working day (AWDT), average day (ADT), peak hours (AM, PM), and day versus night traffic;
- Calibration of travel demand by sub-regions based on the major labor market regions of the Federal Statistical Office;
- Improvement of the distinction between private passenger car traffic and delivery van traffic;
- Adjustment of travel costs in destination and mode choice.
As a further improvement compared to previous model versions, a significantly higehr number of empirical traffic counts could be obtained and integrated into the model calibration: a total of 4,700 motorized vehicle counting stations, 350 bicycle counting stations, 23,000 public transport (PT) counts, and 1,000 rail station frequency counts.
Results
The model calibration achieved all quality statistics defined in advance by the client. A particular achievement is the increased share of endogenously explained transport demand and the reduced exogenous share (calibrated from count values). The updated and improved model was turn-key delivered to the client and is now available for various transport studies. The model was completed on time to be used as the main instrument for developing the Swiss Transport Outlook 2060.
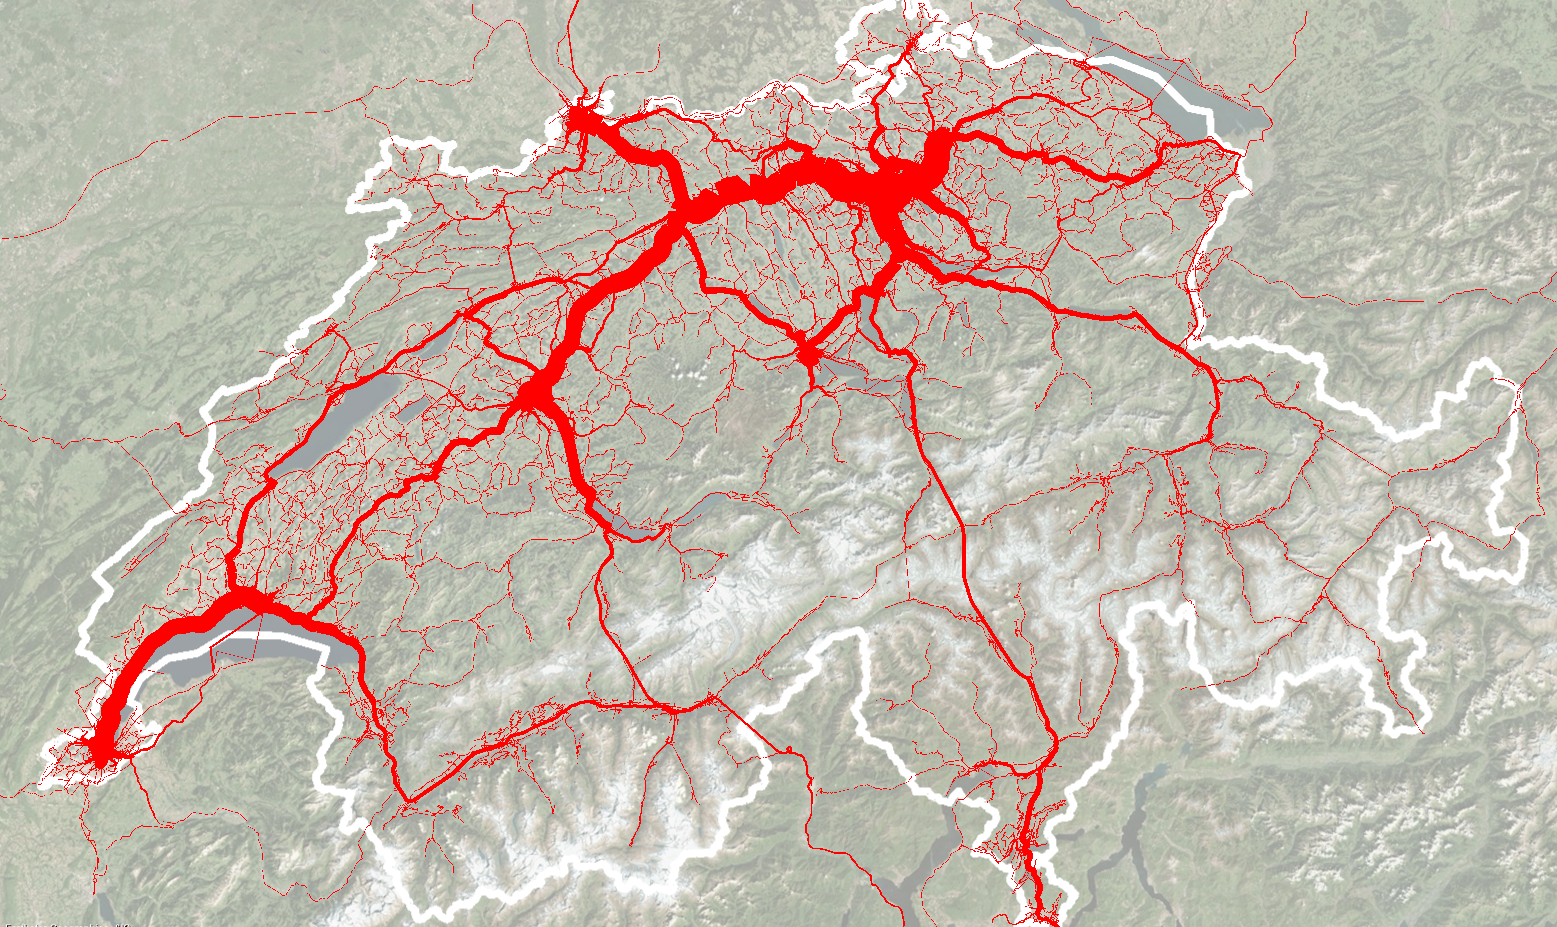
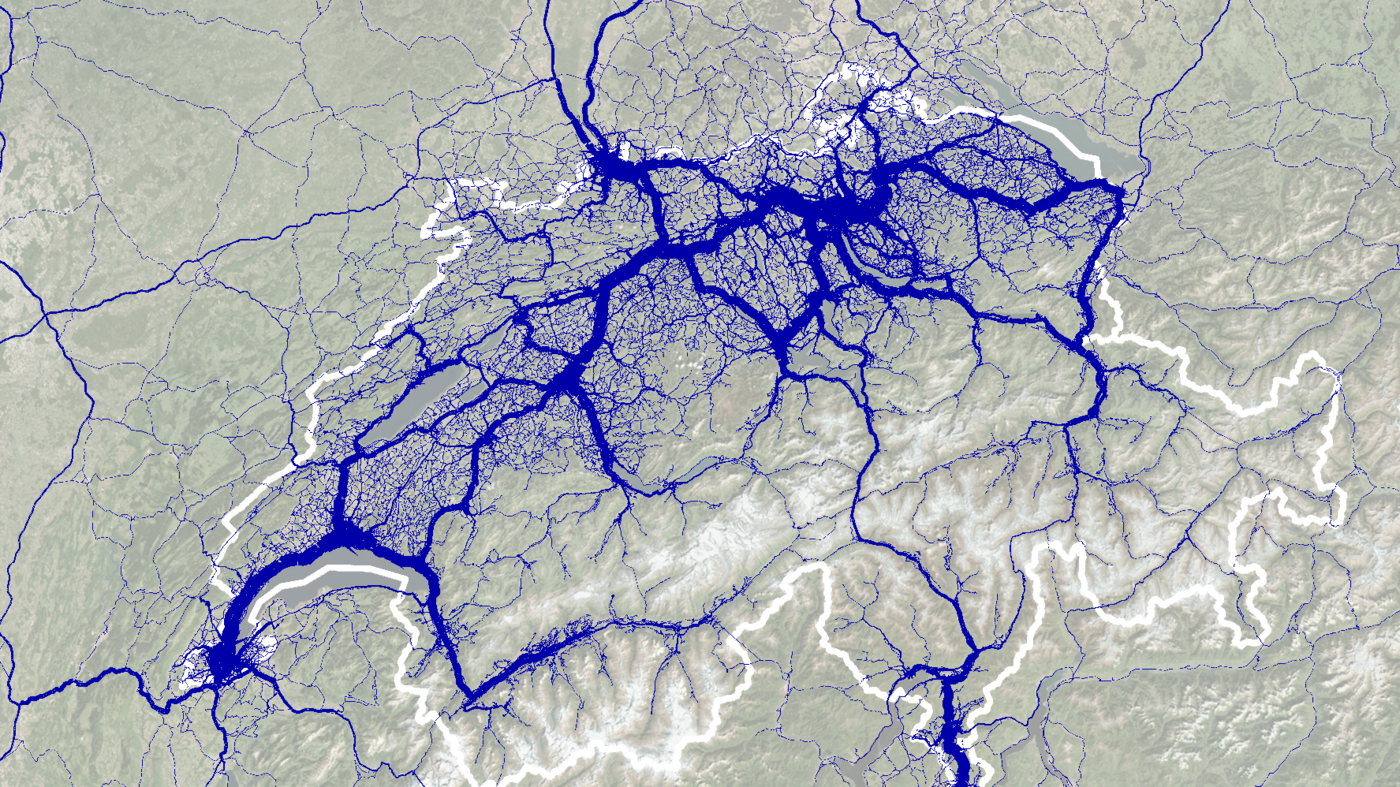
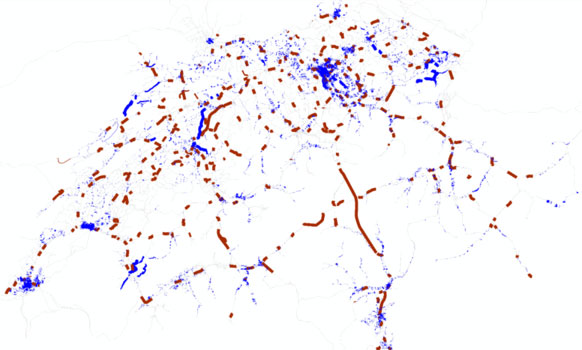
Karte der Verkehrsströme des öV im NPVM 2023 - die Dicke der Balken ist proportional zur Anzahl der beförderten Personen pro Werktag